
We have updated our empirical dataset on Web3 security, extending the study of public audit findings and real-world exploit incidents through 30 September 2026. The corpus now covers almost five years: 27,312 audit findings from 22 security firms and 257 quality-filtered incidents from the rekt.news archive, totalling US$9.69 billion in documented losses. This article covers what the new quarter adds.
In July we closed the Q2 update with a prediction. The first quarter of 2026 had been the quietest in the dataset, and for a few weeks it looked as if code bugs had taken over the loss table. Q2 put that to rest: keys and bridges, US$854 million. We wrote that if the pattern held, we already knew roughly what the Q3 edition would say, and that we would be happy to be wrong.
We were right about the shape and wrong about the mechanism.
The third quarter produced twenty incidents and roughly US$1.07 billion in losses. That is 25 percent more than Q2 and the most expensive quarter since the one that contained Bybit, in early 2025. Human-vector attacks took 57.2 percent of the money, the third quarterly rise in a row. All of that was predictable. What we did not expect is where the money went. It did not leave through signer keys or bridge operators. Half of the quarter’s losses came from two supply-chain compromises. At Bitget (30 September, US$388 million), an attacker used a zero-day in a third-party security product to obtain transfer authorisation without touching a single key, so the exchange’s custody controls were bypassed by the software it had bought to enforce them. At Cold Card (13 August, US$145 million), a hardware-wallet firmware build shipped with its random-number generator replaced by a predictable source, and once that became known, every wallet that had generated keys on that firmware was swept.
Neither event has a root cause an audit could have seen. One lives in a vendor’s product, the other in a build pipeline, and both sit further from the protocol’s own code than key custody does.
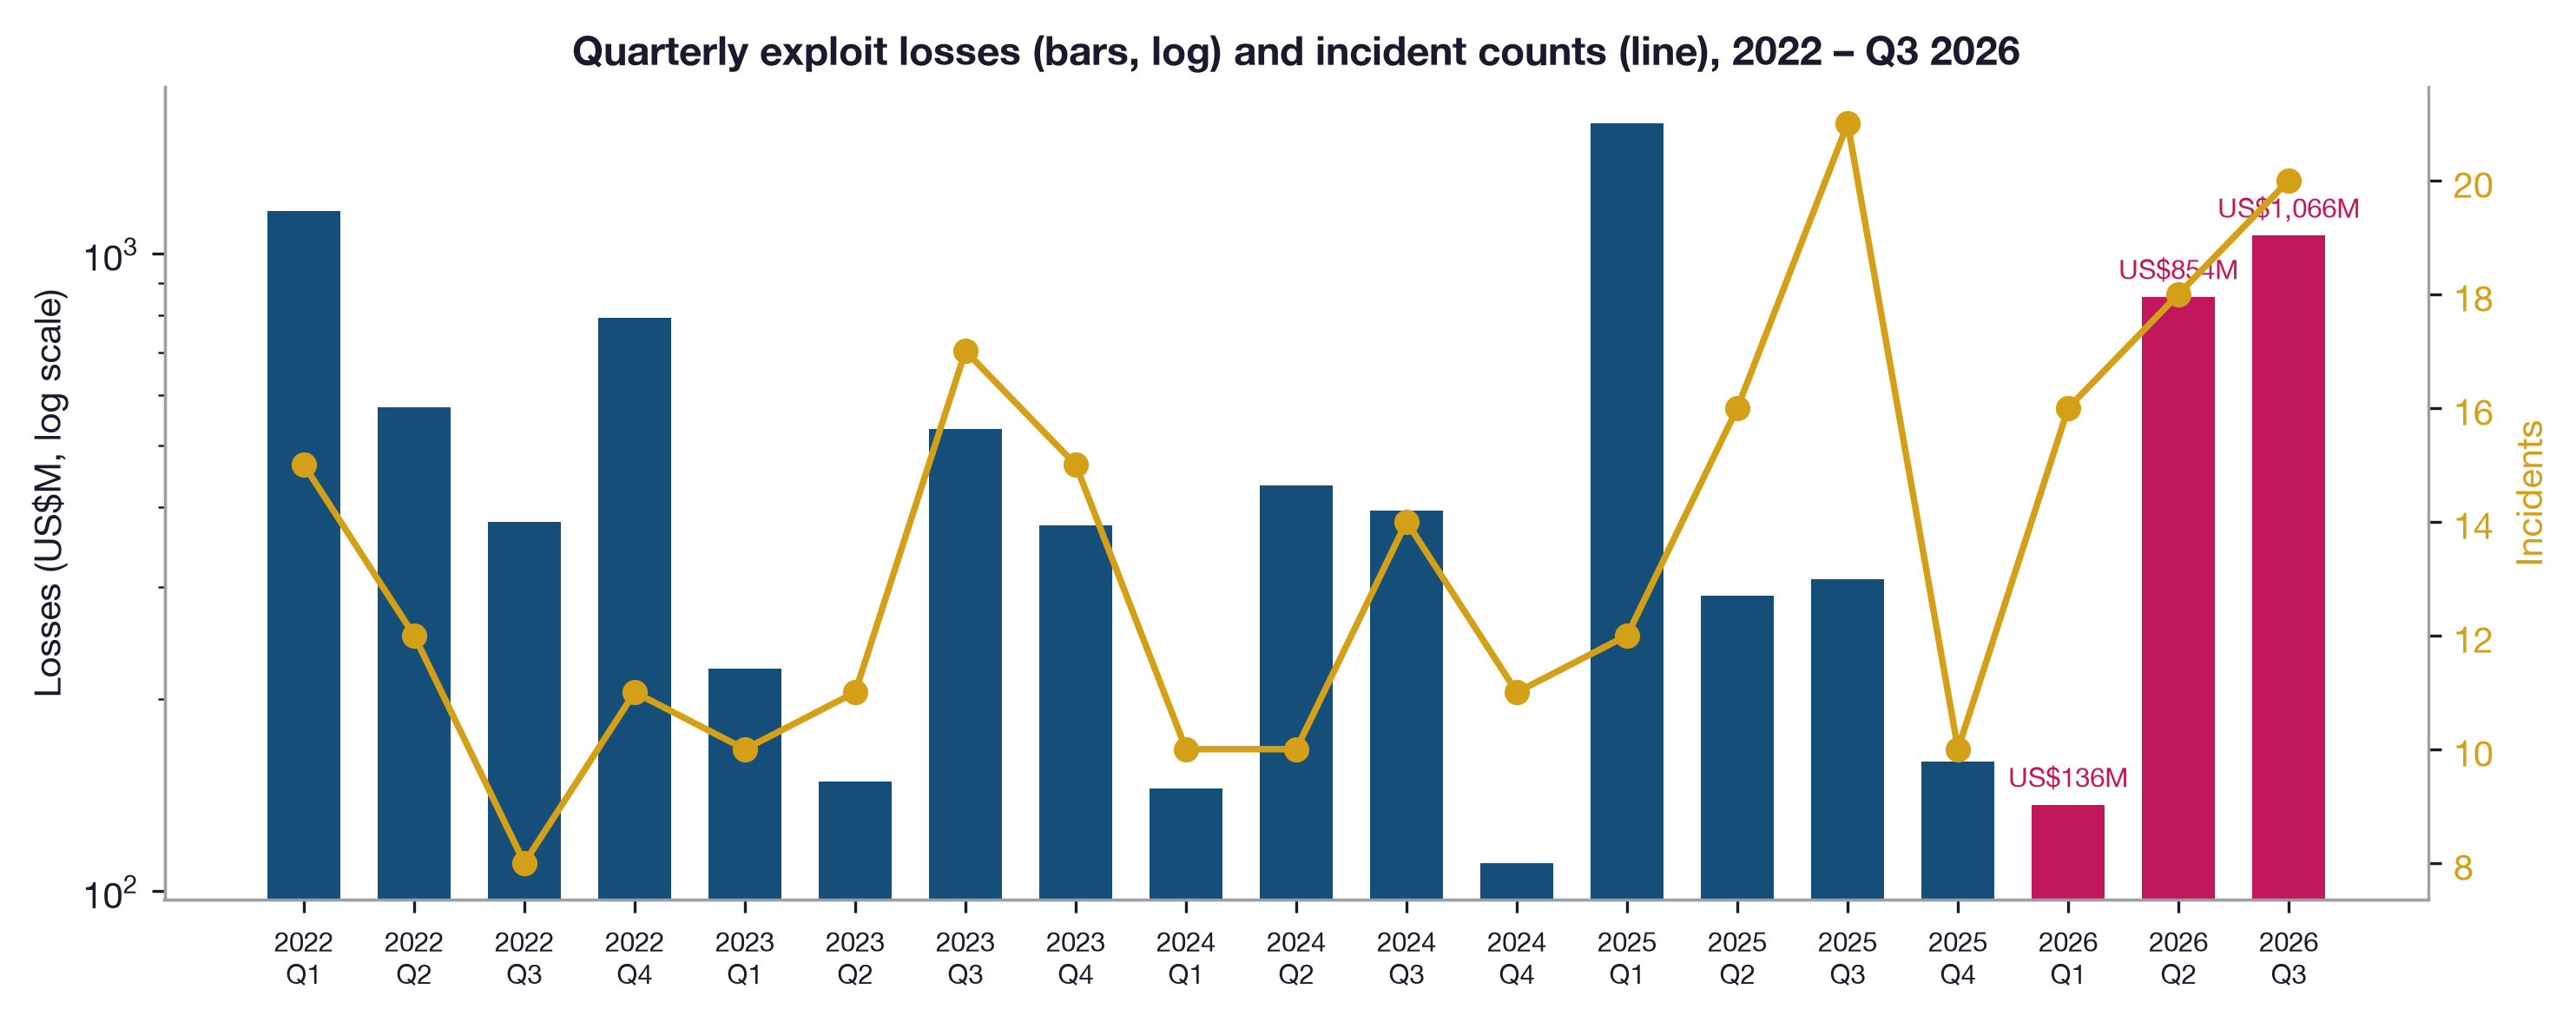
Quarterly exploit losses (bars, log scale) and incident counts (line). The three 2026 quarters are highlighted: the quietest quarter in the dataset, reversion in Q2, and the costliest quarter since early 2025 in Q3.
Three quarters, three different pictures
The side-by-side view of the 2026 quarters tells the story better than any summary number. In Q1 the losses were small and spread over code-level categories, with oracle manipulation on top. In Q2 keys and bridges absorbed almost everything. In Q3 supply chain sits on top, a sidechain peg exploit comes second, and a cluster of arithmetic bugs third. The x-axis grows by an order of magnitude between the first panel and the second.
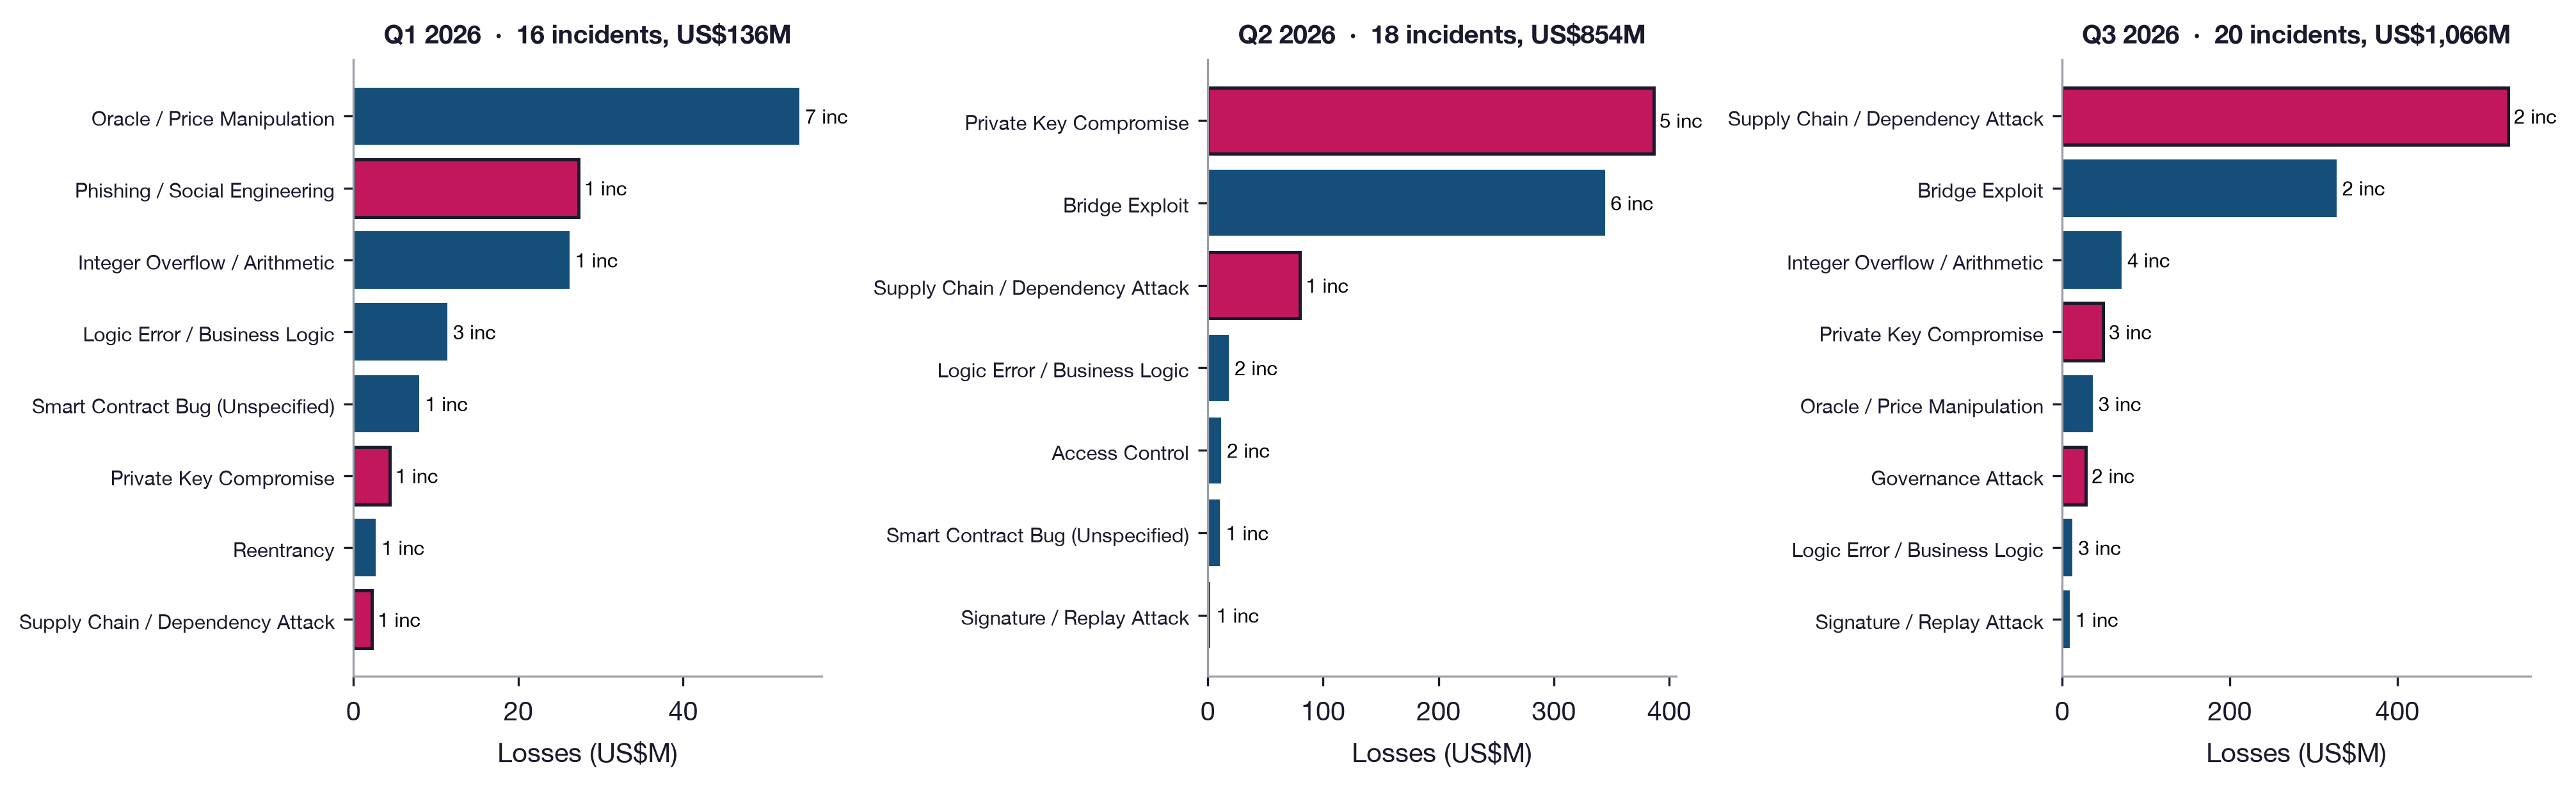
Incident losses by root cause in Q1, Q2 and Q3 2026. Human-vector root causes are outlined. The x-axes differ in scale.
The peg exploit was Liquid Network (16 September, US$320 million), the Bitcoin sidechain. A flaw in how range-proof verification results were cached let an attacker issue unbacked L-BTC and peg out roughly 4,000 BTC. Most of it was returned later; we record the gross theft, as we do everywhere else in the dataset. After Ronin it is the second-largest bridge or peg loss in the study, and like Bitget and Cold Card it did not happen on Ethereum or BNB Chain. The two chains that historically host 88 percent of incidents saw none of the quarter’s three largest losses, and their share of cumulative losses dropped from 92 to 82 percent within one quarter.
One bug, four chains
The code side of the quarter had something we had not seen before. MANTRA, TAC, KiiChain and Nesa, four chains in the Cosmos ecosystem, were all exploited through the same unsigned-integer underflow in a shared upstream EVM-compatibility module, for a combined US$71 million at nominal token prices. Four post-mortems, one defect. We usually talk about dependency risk as a human-vector problem: poisoned packages, compromised vendors, malicious firmware. The Cosmos cluster shows the same propagation mechanism at work on an ordinary arithmetic bug. Shared upstream code spreads bugs across chains in the same way that shared vendors spread compromise across custodians.
The rest of the code-vector incidents were familiar. Three oracle manipulations: Ostium, Nostra, and Tectonic, where US$120 million was borrowed against a pumped collateral token in eleven minutes before Cronos halted and rolled back the chain, leaving US$9 million that had already left. A signature-verification flaw at Bonzo Finance on Hedera. Three logic errors.
What the full dataset now says
The overall picture has the same shape as before and slightly more detail. The categories auditors report most and the categories that lose the most money are still two different lists, and access control is still the only category in the top four of both. Supply-chain compromise has moved into the top five loss categories, at 8.8 percent of cumulative losses over ten incidents, and its mean loss per incident (US$86 million) is now in the same range as bridge exploits.
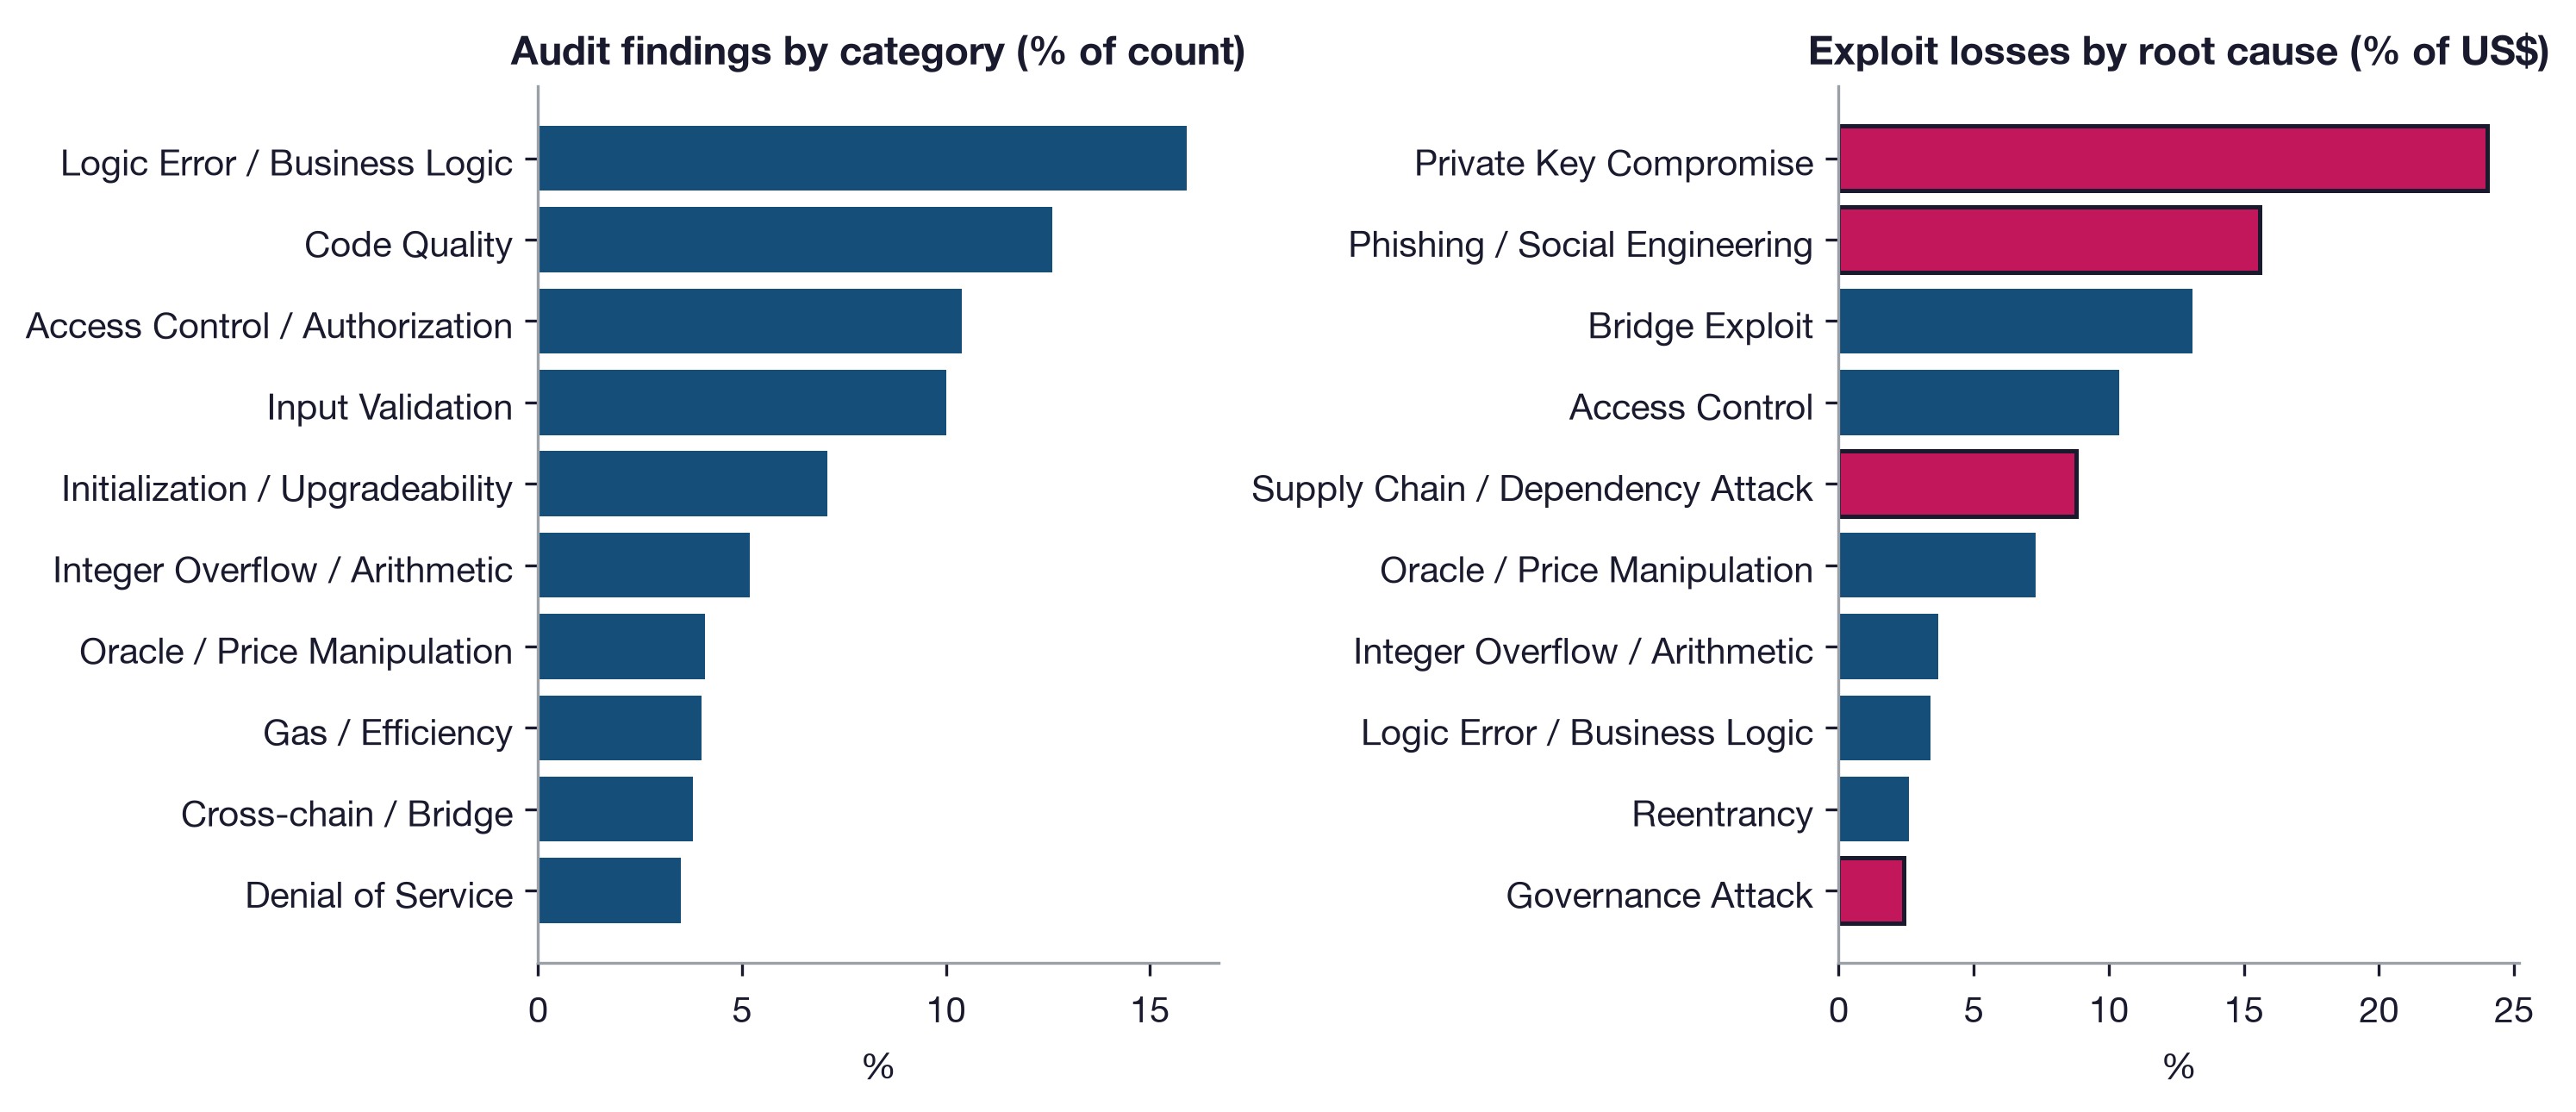
Left: audit findings by category, share of 27,312 findings. Right: realised exploit losses by root cause, share of US$9.69B. Human-vector categories outlined.
Fourteen of the twenty protocols exploited in Q3 had been audited. As in every previous quarter, that number measures scope rather than audit quality. The losses went out through vendor software, firmware builds, peg verification infrastructure, validator keys and governance votes.
What the audit data says
Audit output for the first three quarters of 2026 reached 5,722 findings from 18 firms. Annualised, that is above both the 2025 total and the 2024 peak, so the 2025 contraction in public audit output is over. Q3 itself was the lightest quarter of the year at 1,606 findings from 14 firms. One firm moved its archive from a public repository to a web portal mid-quarter, and several repository-based firms published little.
The audit industry still appears to follow the incident record with a lag of a quarter or two. Signature and replay findings, which doubled in Q1 after Bybit, are back at 4 percent of output. Cross-chain and bridge findings rose to 5.8 percent in Q2, while bridge exploits led the incident count, and fell back to 3.5 percent in Q3. Logic and business-logic findings reached 26 percent of Q3 output, the highest quarterly share so far. The Critical-plus-High share for the quarter, 10.2 percent, is the lowest quarterly reading in the dataset, but that reflects large Informational-heavy batches from web-native sources rather than a change in what reviewers find. Over the four complete years the share has stayed within a few points of 16 percent.
None of this is a complaint about auditors. Nobody expects a smart-contract audit to cover a vendor’s security product or a wallet maker’s firmware build. The problem is that nobody else covers them either.
What teams should take from this
Two of the usual conclusions hold, and the quarter adds a third.
If you custody significant value, your key management and signer workflow are still the primary attack surface. Private-key compromise remains the largest loss category in the dataset: 53 incidents, US$2.33 billion, a mean of US$44 million per event.
If you operate or integrate a bridge or peg, treat it as the component with the worst tail. Bridges account for 13 percent of incidents but 29 percent of losses, and Q3 added the second-largest peg exploit in the study.
The new one is about vendors and build pipelines. The two largest losses of the quarter were a security product and a firmware build, and the Cosmos cluster shows that shared code propagates ordinary bugs with the same efficiency. If you cannot list which third-party software is able to authorise a transfer on your behalf, which build artefacts your users trust, and which upstream modules you share with other chains, your risk surface is bigger than the one you have been reviewing.
With one quarter to go, 2026 is on course to be the second-costliest year in the dataset.
The full updated report, covering January 2022 through September 2026 with complete methodology, figures, and tables, is available at research.oaksecurity.io, together with an interactive data dashboard. Incident data is used with the written permission of rekt.news; audit findings derive from the public output of 22 independent security firms, analysed in aggregate and without firm-level attribution.